Welcome to our latest update on the Tampa Bay real estate market! If you’re looking to buy or sell property in this vibrant area, staying informed about current trends and statistics is essential. In this report, we are going to dive into 4 important factors from the latest data from the first half of 2024 in Tampa Bay.
The Tampa Bay real estate market is seeing a significant increase in inventory. In the St. Pete-Clearwater area, inventory has surged by 107%, while Tampa has experienced an 88% rise. This increase provides buyers with more options and influences the overall market dynamics.
Even with the drastic rise of inventory, the number of homes available on the market is still 46% below 2019 levels in some areas around the bay. For example, there were 5536 single family homes available for sale in Pinellas County (St. Pete-Clearwater) in May 2019 compared to 2981 units available in May 2024. It is important to look at pre-pandemic levels as a reference point of normalcy. The supply of homes is still tight but the increase of inventory is encouraging.
How has the rise of inventory impacted home prices? The average home sales prices are also rising throughout Tampa Bay. In May 2024, the average sales price for a single-family home in St. Pete-Clearwater was $646,647, reflecting a 2.7% year-over-year increase. Meanwhile, Tampa saw a 4.7% rise in average sales price, reaching $556,021. These price hikes indicate a competitive market, despite the increased inventory.
The increased inventory is also affecting the time it takes to sell a property. On average, homes in Tampa Bay are now taking between 63 and 86 days to sell. This extended timeframe is due to buyers having more options and being more deliberate in their decision-making process. Many buyers visit homes multiple times and carefully compare similar properties before making an offer. If you are thinking about selling a home, prepare for a 3 month process from the time your property hits the market until you are sitting at the closing table.
Affordability continues to be a significant factor in the Tampa Bay real estate market. The combination of rising home prices, interest rates, property taxes, and insurance costs is making it difficult for many buyers to afford homes. This challenge is evident when examining the absorption rate, the best indicator of Buyer Demand.
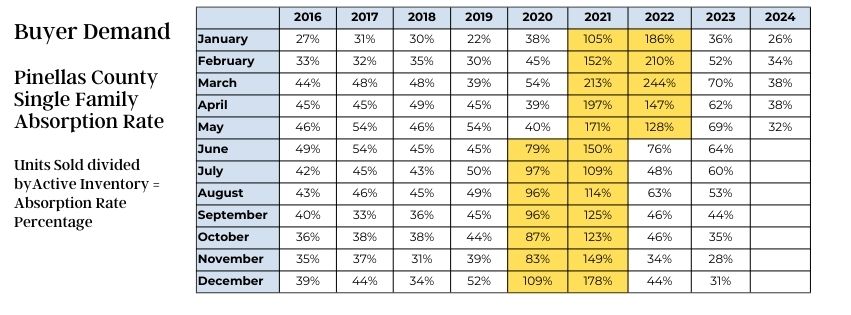
The absorption rate, which measures the number of homes sold compared to the number of homes on the market, was only 32% in May 2024. This means that out of every 100 homes listed, only 32 were sold. This low absorption rate is notable, especially during the peak selling season from March through August.
The chart below shows the absorption rate in Pinellas County for Single Family homes since 2016. From this chart, it is easy to see the impact of interest rates on buyer demand and affordability. Interest rates dropped below 3% in June 2020 and hit 6% in June 2022.

For those looking to sell a home in Tampa Bay, it’s crucial not to “test the market” with your list price. Instead, base your price on recent comparable sales in your area. The sold data is the best indicator of what buyers are willing to pay in a given area for a specific property.
For buyers, the increased inventory provides more options and negotiation power. Rather than focusing solely on lowering the sales price, consider asking the seller to cover mortgage discount points. This strategy can result in more significant monthly savings by reducing your interest rate.
Staying informed about the Tampa Bay real estate market trends is essential for making smart buying or selling decisions. Keep an eye on these trends as we move into the second half of 2024. If you have specific questions, please contact us Contact directly!
For more updates and tips, be sure to subscribe to our blog or our YouTube Channel.
Thank you for reading, and we look forward to helping you navigate the dynamic Tampa Bay real estate market!